⚡ Key Takeaways
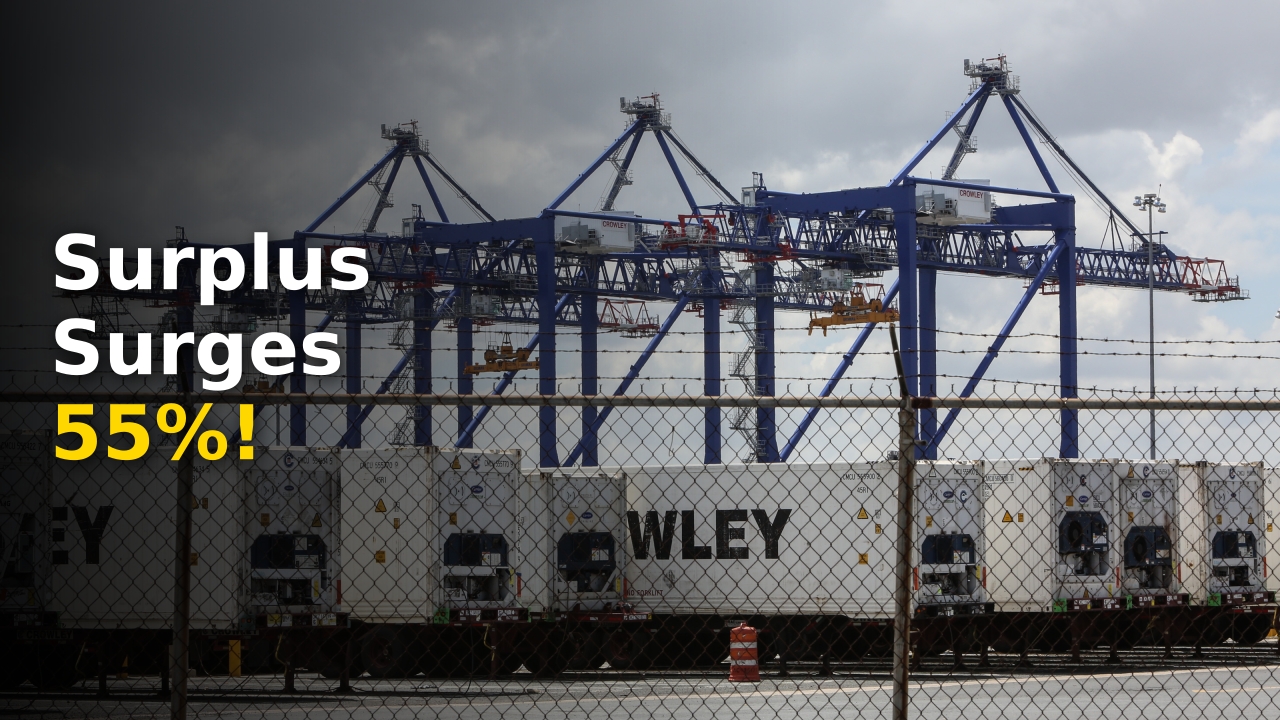
- Puerto Rico registered an astonishing 55.61% year-over-year expansion in its commercial surplus, hitting $6.775 billion.
- The growth occurred despite a 1.61% contraction in total exports, masked entirely by an aggressive 6.03% collapse in imports.
- The United States continues absolute dominance over island commerce, commanding 80.0% of all outbound trade and 69.6% of inbound freight.
- Beverage syrup manufacturing propelled July to the peak performance month with an individual net surplus of $2.489 billion.
- Post-Hurricane Maria generator import volumes have officially cooled after a decade of unprecedented grid disruption.
You might be surprised to learn that a booming trade surplus is not always fueled by surging factory output or record-breaking outbound shipments. In fact, Puerto Rico just recorded a massive 55.61% leap in its commercial trade balance primarily because inbound purchases cratered across several critical industrial sectors.
According to the latest comprehensive data from the Puerto Rico Institute of Statistics (IIPR), the island generated a fiscal net balance of $6,775,075,992. When you peel back the headline numbers, an intriguing economic narrative emerges that challenges standard growth assumptions across Caribbean markets.
While total outbound trade fell by $975.6 million to reach $59,706,839,226, inbound shipments plummeted by more than $3.396 billion down to $52,931,763,234. This severe compression of inbound freight produced a statistical windfall that warrants close examination by institutional investors and policymakers alike.
Trade Surplus Dynamics and Import Declines
Understanding how a regional economy expands its bottom line while aggregate trade volume shrinks requires dissecting specific supply chains. When consumer demand cools or domestic industrial inventories remain saturated, purchase orders from abroad naturally retreat.
During the previous fiscal period, total exports reached $60,682,477,422 against inbound freight worth $56,328,493,804, generating a baseline net balance of $4,353,983,618. The subsequent 1.61% export dip was completely eclipsed by the dramatic 6.03% contraction in foreign acquisition costs.
Market analysts monitoring macroeconomic health often evaluate whether reduced imports signal weakened local purchasing power or strategic supply chain consolidation. In this instance, major manufacturing hubs on the island appear to have optimized their raw input inventories following years of volatile global freight rates.
You can discover broader global trade trends and industrial insights by visiting brightcelebrity.com for continuous coverage of shifting modern commercial developments. The fiscal recalibration taking place across the Caribbean basin reflects broader structural adjustments throughout global manufacturing networks.

The Mechanism Behind Commercial Imbalances
When an economy curtails imports faster than exports diminish, statistical net worth improves on paper immediately. The underlying drivers of this contraction reveal significant shifts in corporate inventory management, intermediate goods purchasing, and household consumer confidence.
- Inbound pharmaceutical chemicals and raw active ingredients normalized after multi-year stockpiling cycles.
- Consumer durable goods orders experienced a moderate pullback amid higher borrowing costs and inflation.
- Capital expenditure on heavy electrical equipment stabilized following years of emergency grid repairs.
- Freight logistics bottlenecks cleared, reducing the need for safety-stock over-ordering by major distributors.
These four operational realities reshaped the island’s commercial balance sheet over twelve consecutive months. Rather than signaling an unprecedented manufacturing boom, the wider margin represents a rationalization of operational procurement strategies.
Global Partners Shaping Commercial Balance
Puerto Rico maintains an exceptionally concentrated network of external trading partners across both hemispheres. Data compiled by government statisticians shows that geographic diversification remains limited, leaving key supply corridors heavily tied to North America and Western Europe.
The United States commands an overwhelming share of all outbound commercial activity, absorbing 80.0% of the island’s export value, which translates to a staggering $47,785,000,000. European trading hubs occupy the subsequent positions, led by Belgium at 3.2%, Spain at 3.2%, the Netherlands at 3.1%, and Brazil capturing 1.5% of total outbound cargo.
On the import side of the ledger, American suppliers similarly dominate the landscape by providing 69.6% of all inbound products, totaling $36,822,000,000. Secondary import partners include Ireland at 4.1%, Singapore at 2.5%, Mexico at 2.0%, and Canada contributing 1.6% of overall receipts.
A historical overview of the Economy of Puerto Rico demonstrates how industrial tax incentives and maritime shipping laws have structurally reinforced this intense bilateral integration with mainland American ports for over seven decades.
| Trading Partner | Export Share (%) | Import Share (%) | Primary Commodity Flow |
|---|---|---|---|
| United States | 80.0% ($47.78B) | 69.6% ($36.82B) | Biopharma, Medical Devices, Heavy Machinery |
| Belgium | 3.2% ($1.91B) | < 1.0% | Specialized Therapeutics, Packaged Pharmaceuticals |
| Spain | 3.2% ($1.91B) | < 1.0% | Chemical Compounds, Consumer Goods |
| Ireland | < 1.0% | 4.1% ($2.17B) | Active Pharmaceutical Ingredients (APIs) |
| Singapore | < 1.0% | 2.5% ($1.32B) | Precision Instruments, Chemical Intermediates |
| China | 0.4% ($246.9M) | 1.4% ($741.0M) | HVAC Units, Electronics, Outbound Medicine |
By The Numbers: The Transpacific Realignment
Direct commercial exchanges between Puerto Rico and China displayed remarkable shifts over the recorded fiscal cycle. Outbound deliveries to Chinese ports reached $246.9 million, consisting primarily of high-value packaged medications and patented pharmaceutical therapies formulated in specialized island plants.
Conversely, China lost its historical market leadership in the air conditioning sector on the island. While Puerto Rican businesses imported $72.54 million in climate-control units from Chinese manufacturers, American suppliers overtook Beijing to capture the top market position in total cooling equipment imports.
Manufacturing Sectors Driving Monthly Surpluses
Seasonal performance varied substantially throughout the fiscal calendar, highlighted by an extraordinary performance during midsummer. The single most profitable monthly performance arrived in July, yielding an individual positive net balance of $2,489,000,000.
This unprecedented monthly spike was heavily stimulated by specialized industrial categories operating across central and northern manufacturing corridors. High-volume shipments of beverage bases, flavor concentrates, and liquid formulations for carbonated soft drinks, energy drinks, and sports beverages experienced massive international demand.
Global beverage conglomerates utilize Puerto Rico’s sophisticated chemical synthesis plants to manufacture proprietary concentrates that flavor millions of retail beverages worldwide. When global bottlers ramp up production ahead of peak consumer seasons, outbound shipments from the island expand dramatically.
Concurrently, the island’s life sciences sector maintained robust export pricing power despite minor volumetric fluctuations. Pharmaceutical manufacturing continues to anchor the regional gross domestic product, shielding the broader commercial ecosystem from acute international downturns.
Expert Take: The Industrial Composition Moat
Industry analysts emphasize that Puerto Rico’s commercial surplus is fundamentally insulated by high-margin intellectual property. Unlike commodity-dependent territories that rely on raw agricultural crops or basic minerals, local production centers on high-barrier biopharmaceutical formulations and proprietary concentrates.
Because replacement costs for regulated biomedical facilities are astronomical, multinational corporations maintain their operational footholds on the island. Even during periods of localized logistical friction, outbound product values remain elevated due to rigorous global quality standards and patent protections.
Decade Long Power Equipment Import Trends
Energy resilience has served as a primary catalyst for capital equipment acquisition across the island over the past fifteen years. A detailed longitudinal analysis of electrical generator imports between fiscal years 2011 and 2026 reveals profound volatility linked directly to major atmospheric and infrastructural emergencies.
The historical peak for generator imports occurred in fiscal year 2018 in the direct aftermath of Hurricane Maria. Inbound shipments from mainland American manufacturers exploded to $155.38 million, while Chinese generator deliveries surged to $19.29 million as residential and commercial operators scrambled to secure backup power.
Between 2021 and 2023, the island experienced a secondary import bump as European manufacturers from Switzerland and France captured temporary market share. High-capacity industrial generators were deployed across healthcare facilities, data centers, and manufacturing complexes seeking uninterrupted operations amidst power grid modernization.
By the 2024–2026 window, however, generator purchases entered a sustained contraction phase. Market saturation, combined with widespread adoption of decentralized rooftop solar and battery storage solutions, substantially lowered the necessity for recurring industrial generator imports.
Long-Term Supply Chain Normalization
The stabilization of heavy machinery imports represents a pivotal transition toward long-term asset management. Industrial operators have transitioned from emergency capital procurement to preventive maintenance protocols, lowering overall foreign capital outflows.
This structural downturn in generator acquisitions directly contributed to the overall 6.03% import decline recorded by government statisticians. As major infrastructure projects transition from equipment acquisition to installation, inbound freight totals naturally compress.
Frequently Asked Questions
Why did the commercial surplus increase if total exports dropped?
The surplus expanded because total imports fell by 6.03% ($3.396 billion), which was more than three times larger than the 1.61% ($975.6 million) contraction in outbound exports, creating a wider positive net margin.
Which country is Puerto Rico’s largest trading partner?
The United States is the dominant trading partner by a wide margin, accounting for 80.0% ($47.785 billion) of all exports and 69.6% ($36.822 billion) of all imported products during the fiscal year.
What specific products drove the massive surplus peak in July?
The record July surplus of $2.489 billion was driven primarily by large-scale shipments of beverage bases, concentrated flavoring powders, liquid syrups for carbonated soft drinks, and high-value pharmaceutical medicines.
Why have generator imports declined in recent fiscal years?
Following historical peaks after Hurricane Maria in 2018 and secondary upgrades through 2023, the market reached saturation while residential and commercial sectors accelerated their shift toward solar power and battery storage systems.
Future Outlook for Commercial Trade Balance
Sustaining an elevated trade surplus over subsequent fiscal quarters will depend heavily on global pharmaceutical demand and the pace of local industrial modernization. As supply chains recalibrate worldwide, the island’s dual strengths in biomedical manufacturing and beverage concentrates provide a sturdy commercial foundation.
Addressing the underlying factors behind declining imports remains essential for policymakers evaluating domestic economic momentum. If lower imports reflect enhanced supply chain efficiency and localized renewable power rather than diminished consumer purchasing power, the island stands well-positioned for balanced fiscal stability.
You can expect ongoing structural adjustments as Puerto Rico integrates advanced automation and expands bilateral commerce with emerging global destinations. The coming fiscal cycles will reveal whether this multi-billion dollar trade balance represents a permanent structural transformation or a temporary inventory correction.
More Like This
For more updates, check out our latest entertainment and sports news.